RankquantRQ
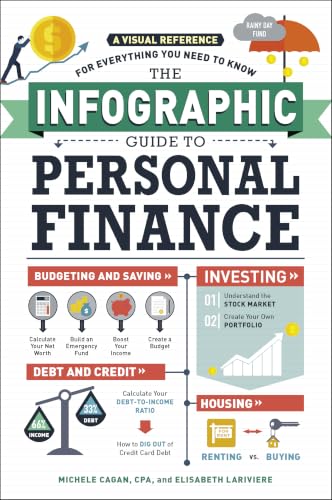
The Infographic Guide to Personal Finance: A Visual Reference for Everything You Need to Know (Infographic Guide Series) cover
global pct
30.8

Book · Michele Cagan · 2017

The Infographic Guide to Personal Finance: A Visual Reference for Everything You Need to Know (Infographic Guide Series)

Scored from 4 calibrated reviewers, each re-centered on their own rating baseline before the book is ranked. Cohort: 2010s books (1,613 books).

30.8%
Global percentile
vs. all 5,285 ranked books
30.7%
In-cohort percentile
2010s books · 1,613 books
31.0%
AI-adjusted percentile
4 calibrated reviewers, thin samples pulled to the mean

Summary

The Infographic Guide to Personal Finance: A Visual Reference for Everything You Need to Know (Infographic Guide Series) is a young-adult title. The catalogue record credits it to Michele Cagan. It was published in 2017.

Its in-cohort standing is measured against the other 1,612 books published in the 2010s. 4 reviewers here rate with enough spread for a personal baseline to be measured, against 5 in the broader raw-average pool. The sample-size-adjusted percentile discounts a sample that size.

How percentiles are computed.

How the score was built

We compare the reviewers of this book against every other book those same people reviewed. Each rating is scored relative to the reviewer's own baseline, so a reader who gives everything five stars is measured against their own five-star habit rather than against a stranger's. Every reviewer then counts the same, so the result is a calibrated consensus rather than a star average.

Global percentile
Where The Infographic Guide to Personal Finance: A Visual Reference for Everything You Need to Know (Infographic Guide Series) lands against every book we rank.
In-cohort percentile
The same comparison narrowed to its cohort — books published in the same decade, so a Victorian novel is judged against Victorian novels rather than against this year's releases. Ranked against 2010s books (1,613 books).
AI-adjusted percentile
The same reviewer-normalized score, corrected for how much confidence the sample supports: thin samples are pulled toward the corpus average. Each book keeps the share n / (n + 53) of its measured distance from the average, where n is its calibrated-reviewer count, and the result is ranked on the same scale as the global percentile.53 is the median sample size across everything we rank. Here n is 4.

Similar percentile

More like The Infographic Guide to Personal Finance: A Visual Reference for Everything You Need to Know (Infographic Guide Series)